On December 16, 2022, the Surface Water and Ocean Topography (SWOT) satellite flew into space aboard a SpaceX Falcon 9 rocket from California's Vandenberg Air Force Base. Jointly developed by NASA and CNES (Centre National D'Études Spatiales), with contributions from CSA (Canadian Space Agency) and the United Kingdom Space Agency (UKSA), SWOT's mission is to monitor Earth’s surface water with unprecedented detail and accuracy, capturing the first global survey of the planet's surface water.
In March 2024, the SWOT mission team released a suite of pre-validated Level 1 and Level 2 hydrology and oceanography datasets offering terrestrial water surface elevation, slope, width, area, sea surface height, significant wave height and wind speed measurements, and more. Information about these new datasets will follow a brief overview of the SWOT mission, how these data are acquired, and data applications.
SWOT Overview
The SWOT mission will provide critical information that can support assessment of water resources on land, track regional sea level changes, monitor coastal processes, and observe small-scale ocean currents and eddies.
In brief, SWOT data will allow hydrologists and oceanographers to:
- Estimate river flow as well as lake and reservoir volume changes around the globe, track how much water is flowing through hundreds of thousands of river reaches wider than 330 feet (100 meters), and keep a close watch on the levels of more than a million lakes larger than 15 acres (6 hectares)
- Create detailed maps of rivers, lakes, and reservoirs that will enable accurate monitoring to provide a view of freshwater resources, even in remote locations
- Provide derived volumetric measurements of rivers, lakes, and reservoirs to help hydrologists better track droughts and floods
- View the ocean with unprecedented clarity, allowing scientists to detect features such as fronts, eddies, and waves as small as a few kilometers, and—for the first time—provide information that will improve physics models and forecasts
- Better understand the role the ocean plays in climate change by inferring how much heat and carbon the ocean absorbs from the atmosphere
- Monitor sea level, tides, and coastal sea level variations all the way into estuaries for the first time, at a resolution that will contribute to the understanding of local coastal changes

Altimetry and Beyond
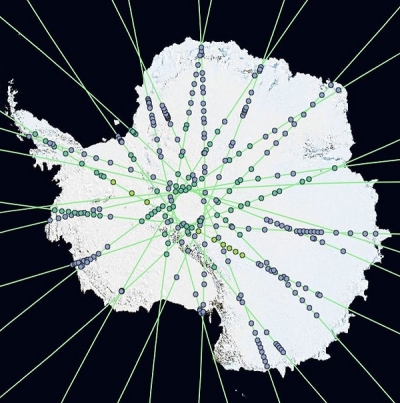
From its orbit 554 miles (891 kilometers) above the planet, SWOT scans Earth's surface between 78° North and 78° South latitude. The satellite covers the entire planet every 21 days (one cycle), and during that time observes more than 90% of Earth’s surface water.
Like the legacy satellite altimetry missions tasked with documenting the height of the ocean surface, SWOT is outfitted with a Poseidon-3C nadir altimeter that determines sea surface height by measuring the time it takes for a signal to travel straight down to the surface and then back up to the satellite.
SWOT also carries a novel instrument called the Ka-band Radar Interferometer (KaRIn), which uses a part of the microwave portion of the electromagnetic spectrum (i.e., the Ka-band) and the principles of synthetic aperture radar (SAR) combined with interferometry to measure the surface height of water. KaRIn obtains these measurements by emitting a cloud-penetrating microwave radar signal from one end of the satellite’s 10-meter-wide boom. When the signal hits the surface and gets reflected back, antennae on both ends of the boom receive the signal, allowing it to capture data from two 30-mile (50-kilometer) wide swaths on both sides of the spacecraft. (The altimeter aboard SWOT collects data, in part, in the 12-mile [20-kilometer] gap between KaRIn's swaths.)
Having two antennae results in signals that are slightly out of sync (or relative phase) because they travel different distances. However, these two measurements can be combined into an interferogram—a type of image that shows patterns of interference between the two measurements.
SWOT's leading-edge instruments will benefit the study of Earth’s ocean by enabling scientists to detect ocean features with 10 times better resolution than present technologies.
"The excitement of SWOT for oceanography is that it provides a wholly new, instantaneous view of the ocean—a birds-eye view of water height at an order-of-magnitude finer resolution than was previously possible" said Dr. Matthew Archer, an oceanographer at NASA’s Jet Propulsion Laboratory (JPL). "It’s like putting a pair of spectacles on the previous satellites: suddenly, what was blurry is now clear; what we could only guess at from hints in the older measurements, we now see with clarity from SWOT."
Why does it matter if oceanographers can see the ocean's height at a finer resolution than before? Because the small things matter, says Archer.
"What we have learned from supercomputer simulations in the past decade is that small-scale ocean features affect the large-scale climate by feeding in or sucking out energy from large ocean eddies, as well as exchanging heat, carbon, and momentum with the atmosphere," he said.
SWOT provides more detailed observations of terrestrial surface water too.

"For terrestrial hydrology, traditionally we’ve had in-situ measurements, like gauges that measure lake height and river flow rates, but those are at specific points on the ground," said Dr. Catalina Taglialatela, applied science systems engineer at NASA’s JPL and NASA's Physical Oceanography Distributed Active Archive Center (PO.DAAC). "SWOT's vantage point from space complements these in-situ observations, offering a more complete picture of the water cycle, specifically for our rivers, lakes, and reservoirs across the world."
In terms of hydrology, this more holistic view not only includes the location of these water bodies, but observations of their water extent and height as well.
"It's incredibly impactful that, with the SWOT measurement on land, we have a unique way to measure water extent. What that means is we’ll be able to know where the water is on the continent and how far it goes in the floodplain during a flood event. And associated with the water extent, we'll also have information about its elevation," said Dr. Cédric David, a hydrologist at NASA’s JPL. "When you know where the water is, the water extent, and how high it is, you can start doing some really cool things, like computing the slope, which tells you something about how water is flowing. We haven’t had that before."
Such measurements, coupled with the information we’ll be able to derive from them, will enhance our collective ability to manage freshwater resources around the globe.
"From the water management perspective, knowing the changes in Earth's water stores—the natural lakes and the reservoirs we rely on in times of drought—and understanding the variability of the amount of fresh water that is easily accessible and renewable is incredibly important for sustainability," David said.
SWOT will also enhance our ability to prepare for flooding emergencies by providing researchers, disaster monitors, and communities with hydrological data that have traditionally been too costly to obtain, difficult to access, or simply not shared.
"If we're going to deal with a fast-evolving planet, both in terms of climate and increasing populations, we have to tackle that as a team," said David. "Now with SWOT, we have this instrument that flies all around the world collecting data, which NASA shares with everyone. The data will be imperfect, but at least they will be a unified measurement for the entire planet. So, now we're going to have some sense of what's going on and it will provide some perspective both upstream and downstream and it may start some conversations."
SWOT Level 1 and Level 2 Datasets Now Available
All of these datasets are archived and distributed to users by PO.DAAC. Included in this suite of data products are:
Level 1B Interferogram and Single-Look Complex Products

Level 2 High Rate (HR) Products (typically used for Hydrology applications)

Level 2 Low Rate (LR) Products (typically used for Oceanography applications)

These pre-validated data products use improved algorithms and calibrations developed after the release of the SWOT beta pre-validated products on December 1, 2023. The data products will be validated during the mission’s validation meeting, currently scheduled for June 2024.
Recommendations for Using SWOT Data
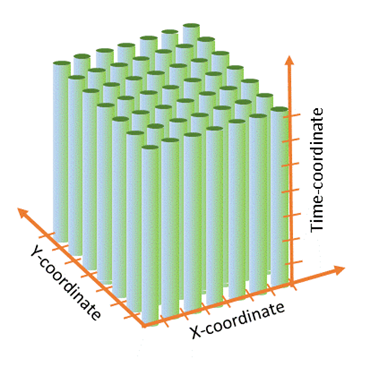
Before engaging with these SWOT datasets, users are encouraged to familiarize themselves with the spatial formats for each of the SWOT Level 2 products, in particular those for inland water. Some of the products are in "swaths" (yellow) or half-globe orbit tracks; some are in "tiles" (green) or 64 x 64 square kilometer (km2) half-swath widths; some are in "scenes" (red), 128 x 128 km2, georeferenced, full swath widths. (See the color-coded areas in the spatial extent graphic at right.)

For additional information users can refer to the Product Description Documents and other User Documentation found on the PO.DAAC SWOT mission page.
Further, PO.DAAC has developed a variety of file naming conventions to facilitate the spatial search of SWOT data products. These conventions refer to both the spatial extent and contents of each file, and are summarized in a chart found in the "Tips for SWOT Spatial Search" section of the PO.DAAC Cookbook.
"Our cookbook is an online curated catalog of data resources and tutorials. Within it, we have created a chapter on SWOT," said Taglialatela. "It contains much of the same information we presented during our recent Earthdata webinar, but it allows for more self-paced learning, so users can read through it, figure out which data are best suited for their needs, and begin working with [the data]."
It’s important to provide users with a variety of educational resources, Taglialatela said, because some members of the hydrology community may not be accustomed to working with data of this type.
"Although users might be accustomed to working with gridded data from models or in-situ data from instruments like stream gauges, they may not be as familiar with remote sensing data for hydrology and water resource studies because the data are so new," she said. "So, sharing and building knowledge within the community about what these data look like and how they can be accessed is an important and helpful step."
Users can access SWOT data and a variety of learning resources from PO.DAAC at the links below.
Data Access
Users can access this suite of SWOT data using NASA's Earthdata Search or through PO.DAAC.
Learning Resources
- PO.DAAC SWOT Mission Page: Datasets Information and User Documentation
- Webinar: Accessing Data for the World's Water with the SWOT Mission
- PO.DAAC Cookbook
- Webinar: PO.DAAC: An Open Ocean of Remote Sensing and In Situ Data for Science in the Cloud
- Data Tutorial: PO.DAAC Open Office Hour for SWOT Beta Pre-Validated Products
- PO.DAAC Workshop: Accessing SWOT Hydrology Data
- SWOT 101: A Mission Primer
- SWOT Swath Visualizer
- For general questions: Earthdata Forum - SWOT